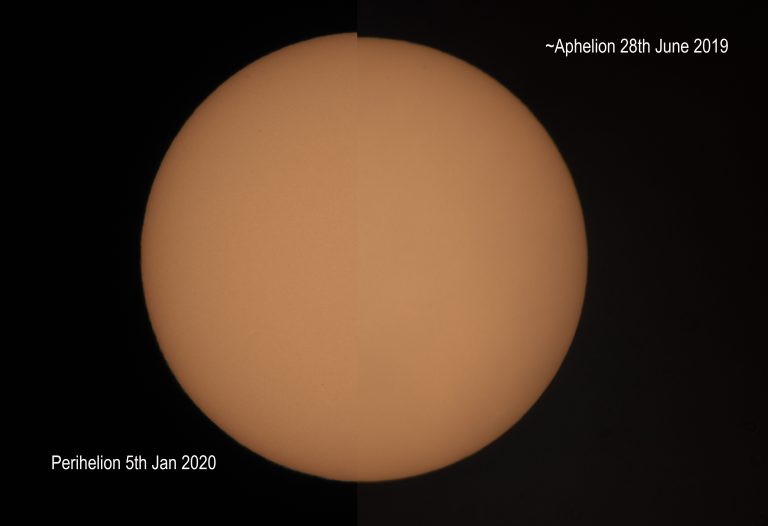
近日点与远日点的太阳

近日点与远日点的太阳

2020 January 9 Perihelion to Aphelion Image Credit & Copyright: Ian Griffin (Otago Museum) Explanation: Perihelion for 2020, the point in Earth’s elliptical orbit when it is closest to the Sun, occurred on January 5th. The distance from the Sun doesn’t determine the seasons, though. Those are governed by the tilt of Earth’s axis of rotation, so January is still winter in the north and summer in southern hemisphere. But it does mean that on January 5 the Sun was at its largest apparent size. This composite neatly compares two pictures of the Sun, both taken from planet Earth with the same telescope and camera. The left half was captured on the date of the 2020 perihelion. The right was recorded only a week before…

摩洛哥的小阿特拉斯山脉

摩洛哥的小阿特拉斯山脉

The Anti-Atlas Mountains of Morocco formed as a result of the collision of the African and Eurasian tectonic plates about 80 million years ago. This collision destroyed the Tethys Ocean. The limestone, sandstone, claystone and gypsum layers that formed the ocean bed were folded and crumpled to create the Anti-Atlas Mountains. In this image of southwest Morocco, visible, near infrared and short wavelength infrared bands are combined to dramatically highlight the different rock types, and illustrate the complex folding. The image was acquired on November 5, 2007, by the ASTER instrument on the Terra satellite. Terra launched 20 years ago in December 1999, beginning a new era in the study of Earth. Terra, flagship of the agency’s Earth Observing System, was built to last for…

璀璨的夜空:黑暗中的美洲

璀璨的夜空:黑暗中的美洲

This image of North and South America at night is a composite assembled from data acquired by the Suomi NPP satellite in April and October 2012. The new data was mapped over existing Blue Marble imagery of Earth to provide a realistic view of the planet. For more such images of our planet, read Earth at Night, NASA’s latest ebook that features dazzling photographs and images from space of Earth’s nightlights. For nearly 25 years, satellite images of Earth at night have served as a fundamental research tool, while also stoking public curiosity. The images paint an expansive and revealing picture, showing how humans have illuminated and shaped the planet in profound ways since the invention of the light bulb 140 years ago. This image’s…

冰川在运动:卫星拍摄到了冰川数十年的变化

冰川在运动:卫星拍摄到了冰川数十年的变化

从太空中拍摄到的地球冰川和冰原的新延时视频——有些已有近50年历史——为科学家提供了了解地球冰冻区域变化的新视角。 从太空中拍摄的地球冰川和冰原的新延时视频跨越了近50年,为科学家们提供了了解地球冰冻区域变化的新视角。 来源:NASA / Matt Radcliff 在12月9日于旧金山举行的美国地球物理联合会年会上的一次新闻发布会上,科学家使用来自包括NASA-U.S. 地球资源探测卫星(Landsat)任务在内的卫星数据发布了阿拉斯加,格陵兰和南极洲的新时间序列图像。一系列的图片说明了阿拉斯加冰川的巨大变化,并可能警告未来哈伯德冰川的消退。在格陵兰岛,不同的卫星记录显示,从2000年开始,冰川消退速度加快,而在过去十年里,融水湖向更高的海拔蔓延,这可能会加速冰的流动。在南极的冰架上,从太空中可以看到隐藏在冬季积雪下的湖泊。 阿拉斯加费尔班克斯大学(the University of Alaska Fairbanks)的冰川学家Mark Fahnestock利用从1972年到2019年的地球资源卫星拍摄的图像,将阿拉斯加和育空地区所有冰川的6秒延时图像都拼接在一起。 “现在,我们已有如此漫长而详尽的记录,使我们能够了解阿拉斯加发生了什么。”Fahnestock说,“当您播放这些影片时,您会感觉到这些系统的动态性以及冰流的不稳定程度。” 在2019年6月的地球资源卫星图片中,格陵兰岛的彼得曼冰川表面形成了融水湖。一项新的研究发现,格陵兰岛融水湖的数量正在增加,融水湖的海拔也在增高。 影像来源:NASA / USGS 他说,这些视频清楚地说明了气候变暖对阿拉斯加冰川的影响,并强调了不同冰川如何以不同的方式做出反应。一些迹象表明,潮涌会暂停几年,或者在曾经结冰的地方形成湖泊,甚至是山体滑坡的碎片流入大海。其他冰川显示出的模式为科学家们提供了冰川变化的线索。 例如,当1972年发射第一颗陆地卫星时,哥伦比亚冰川相对稳定。但从20世纪80年代中期开始,冰川前缘开始迅速消退,到2019年,上游距离冰川12.4英里(20公里)。相比之下,哈伯德冰川在过去48年里已经前进了3英里(5公里)。但是Fahnestock的延时拍摄以一张2019年的图片结束,图片显示冰川上有一个大的凹陷,那里的冰已经断裂。 他说:“这是近50年来哈伯德冰川首次出现崩裂的迹象,它一直在打破历史记录。”他表示,如果这种冰穴在未来几年持续存在,这可能是哈伯德面临变化的一个迹象。“卫星图像还显示,在哥伦比亚冰川消退之前的10年里,就存在这种冰穴。” 陆地资源卫星提供了最长的连续的地球空间记录。美国地质调查局对旧的陆地资源卫星图像进行了重新处理,使Fahnestock能够挑选出每条冰川在夏天最清晰的陆地资源卫星图像。利用谷歌地球引擎的软件和计算能力,他创作了一系列延时视频。 科学家们也在利用长期的卫星记录来观察格陵兰冰川。俄亥俄州立大学的Michalea King分析了1985年Landsat任务的数据,研究了超过200个格陵兰岛的大型出口冰川。她研究了冰川前缘退缩了多远,冰川流动的速度有多快,以及在这段时间里冰川消失了多少。 她发现,从1985年到2018年,格陵兰岛的冰川平均消退了约3英里(5公里),但消退最快的时期是2000年至2005年。当她观察流入海洋的冰川数量时,她发现在有记录的前15年里,冰川数量相对稳定,但在2000年左右开始增加。 “与过去相比,这些冰川正在向海洋崩解更多的冰,”King说。“在1985年至今的记录中,冰川退缩和冰川质量损失的增加之间有着非常明显的关系。英国利物浦大学的James Lea利用卫星数据研究了格陵兰岛冰川和冰原顶部的冰融化情况,从而形成了融水湖。 Lea说,这些融水湖直径可达3英里(5公里),在几小时内就能从冰中流过,这可能会影响冰的流动速度。Lea利用谷歌地球引擎的计算能力,利用Terra卫星上的中分辨率成像光谱仪(MODIS),分析了格陵兰冰原在过去20年里每个融化季节每天的图像——总共超过18000张图像。 “我们研究了冰原上每年有多少个湖泊,发现在过去20年里湖泊数量呈上升趋势:增加了27%。”Lea说。“我们也在越来越多的高海拔地区发现湖泊,我们原本期望到2050年或2060年前才会在这些地区看到湖泊。” 他说,当这些高海拔的融水湖冲过冰盖并排干水过程中,可能会导致冰盖加速融化,使冰层变薄,加速其消亡。 研究极地特征并不总是需要几十年的数据——有时只需要一两年就能提供见解。南极冰盖表面正在融化,但在地表以下几米的地方也有湖泊,它们被层层积雪隔绝。为了弄清这些地下湖泊的位置,科罗拉多大学博尔德分校( the University of Colorado, Boulder)的Devon Dunmire使用了欧洲航天局Sentinel-1卫星的微波雷达图像。水和冰对于微波辐射基本上是看不见的,但是液态水强烈地吸收它。 Dunmire在AGU会议上提出的新研究发现,南极半岛附近的乔治六世和威尔金斯冰架上散布着湖泊,甚至有一些在整个冬季都保持液态。 她说,这些隐藏的湖泊可能比科学家们想象的更常见。她指出,她正在继续在整个大陆的冰架上寻找类似的特征。 “关于这些地下湖泊的分布和数量,我们所知不多,但这些水似乎普遍存在于南极半岛附近的冰架上,”Dunmire说,“这是需要了解的一个重要组成部分,因为已经证明融水会破坏冰架的稳定性。” 有关地球资源卫星和即将到来的地球资源卫星9号任务的更多信息,请访问:https://nasa.gov/landsat 或 https://usgs.gov/landsat

地球变化中的冰川

地球变化中的冰川

Meltwater lakes form on the surface of Greenland’s Petermann Glacier, seen here in a June 2019 Landsat image. A new study finds that the number – and elevation – of meltwater lakes in Greenalnd is increasing. How do scientists know? Earth’s glaciers and ice sheets as seen from space – some spanning nearly 50 years – are providing scientists with new insights into how the planet’s frozen regions are changing. Learn More: Ice in Motion: Satellites Capture Decades of Change Image Credit: NASA/USGS 在2019年6月的地球资源卫星图片中,格陵兰岛的彼得曼冰川表面形成了融水湖。一项新的研究发现,格陵兰岛融水湖的数量正在增加,融水湖的海拔也在增高。科学家是怎么知道的?从太空中看到的地球冰川和冰原——其中一些跨越了近50年——为科学家提供了了解地球冰冻区域如何变化的新视角。 了解更多:冰川的运动:卫星拍摄到的数十年的变化 影像来源:NASA/USGS

截至2030年,地球上的海平面将上升多少?

截至2030年,地球上的海平面将上升多少?

Jason-CS/Sentinel-6任务将追踪海平面上升,这将是未来10年全球变暖最明显的迹象之一。该任务由两颗卫星组成,上图中是第一颗卫星Sentinel-6A正在位于德国的洁净室里进行展示,该卫星计划于2020年11月发射。 版权:德国工业设备管理公司(IABG) 地球上的气候正在发生改变,而关于海洋的研究对于理解气候变化对未来的影响至关重要。美国和欧洲正准备发射Sentinel-6/Jason-CS卫星,以继续研究全球变暖最明显的迹象 – 海平面上升。该卫星将在轨道上运行10年,将是持续时间最长的任务。Sentinel-6/Jason-CS任务(Jason-Continuity of Service的简称)旨在回答这样一个问题:截至2030年,地球上的海平面将上升多少? 截至2030年,包括Sentinel-6/Jason-CS提供的数据,将拥有近40年的海平面记录,为我们提供人类如何改变地球及其气候的最清晰、最敏感的测量数据。 该任务由两颗一模一样的卫星组成,分别是Sentinel-6A和Sentinel-6B,两个卫星发射时间相隔5年。11月15日,Sentinel-6A卫星在IABG空间试验中心的洁净室里向媒体进行了最后一次展示。该卫星将于2020年11月在加州范登堡空军基地由SpaceX的“猎鹰9号”火箭搭载发射。 Sentinel-6/Jason-CS将紧随其他四个欧美联合发射的卫星任务(TOPEX/Poseidon海洋环流测量任务,Jason-1任务,Jason-2/海洋表面地形任务(OSTM)/和Jason-3高精密度海洋测高任务)的步伐。这些任务对过去30年间的海平面上升进行了测量,期间收集的数据显示地球海平面平均上升速率为每年0.1英寸(3毫米)。 Sentinel-6/Jason-CS在继续研究海平面变化的同时,还将研究海洋环流的变化,气候变化(例如厄尔尼诺现象和拉尼娜现象)和天气模式,包括飓风和风暴等。 美国航空航天局(NASA)对地观测卫星的数据显示,2019年10月29日至11月7日期间,地球海平面在不断上升。图中红色区域表示海平面较高,蓝色区域表示海平面最低。欧美联合发射的Sentinel-6/Jason-CS任务将继续努力追踪海平面上升。 版权:NASA/喷气推进实验室-加州理工学院(JPL-Caltech) 来自NASA喷气推进实验室的项目科学家乔希•威利斯(Josh Willis)表示:“在某种程度上,全球海平面上升是对人类如何改变气候的最全面测量。如果你仔细想想,全球海平面上升意味着地球表面约70%的区域正在变高,也就是说地球的70%正在经历形状改变并持续发生变化。因此,整个地球都在发生改变,这才是我们所真正测量的。” 几十年间的太空和地面观测记录了地球表面温度的快速上升。海洋吸收了自工业革命以来排放到大气中的过量温室气体(如二氧化碳)所产生的90%以上的热量,从而有助于地球气候保持稳定。 随着海洋变暖,海水会膨胀从而增加水体体积;储存于海洋中的热量还会融化冰原和冰川,进一步导致海平面上升。在过去的25年里,海平面上升速度一直在加快,预计未来几年还将继续加快。 Sentinel-6/Jason-CS任务对本世纪20年代期间全球海平面上升幅度和上升速度的测量将精确到毫米尺度。随着海平面上升,人类将需要适应海平面上升所导致的的后果 – 包括洪水、海岸侵蚀、风暴带来的危险以及对海洋生物的负面影响。 除了测量海平面上升,该任务还将提供有助于天气预测的数据集,评估大气中的温度变化,并收集高分辨率的大气层垂直空气柱的剖面温度和湿度。 与之前的Jason系列卫星一样,Sentinel-6/Jason-CS卫星将每10天收集一次全球海洋数据,为研究厄尔尼诺等大型海洋现象提供依据。然而,与之前的Jason系列任务不同,Sentinel-6/Jason-CS上的高分辨率仪器还将能够提供关于较小海洋特征(包括复杂的洋流)的数据,这将有利于导航和渔业社区。 Willis表示:“全球海平面上升是气候变化最昂贵、最具破坏性的影响之一。在我们的有生之年,我们将不会看到全球海平面大幅下降。我们所描绘的实际上是未来几代人必须应对的海平面上升幅度的情况。” Sentinel-6 / Jason-CS卫星由欧洲航天局(ESA),欧洲气象卫星开发组织(EUMETSAT),NASA和美国国家海洋和大气管理局(NOAA)联合研发,并获欧盟委员会(European Commission)和法国国家太空研究中心(CNES)的资金支持。Sentinel-6任务中,NASA负责两颗Sentinel-6卫星的科学仪器有效载荷、这些卫星的发射服务、支持科学仪器运作的地面系统,并对国际海洋表面形貌科学小组提供支持。 欲了解更多NASA关于研究气候变化的任务,请访问: https://climate.nasa.gov 欲了解更多NASA关于海平面上升的研究,请访问: https://sealevel.nasa.gov 若有兴趣,可以在Earth Now查看最新的海平面数据。 来源:https://www.nasa.gov/feature/jpl/new-earth-mission-will-track-rising-oceans-into-2030

水星凌日

水星凌日

2019 November 10 A Mercury Transit Sequence Image Credit & Copyright: Dominique Dierick Explanation: Tomorrow — Monday — Mercury will cross the face of the Sun, as seen from Earth. Called a transit, the last time this happened was in 2016. Because the plane of Mercury’s orbit is not exactly coincident with the plane of Earth’s orbit, Mercury usually appears to pass over or under the Sun. The featured time-lapse sequence, superimposed on a single frame, was taken from a balcony in Belgium shows the entire transit of 2003 May 7. That solar crossing lasted over five hours, so that the above 23 images were taken roughly 15 minutes apart. The north pole of the Sun, the Earth’s orbit, and Mercury’s orbit, although all different,…

从空间站观测加利福尼亚的野火

从空间站观测加利福尼亚的野火

From the vantage point of space aboard the International Space Station, NASA astronaut Andrew Morgan captured this image of a California wildfire. On his Facebook page, he said: “From the International Space Station I was able to catch these pictures of the California wildfires burning north of the Bay Area. Thinking of the people who have lost their homes and the brave first responders on the front lines protecting them.” In addition, NASA’s Earth-orbiting satellites are often the first to detect wildfires burning in remote regions, and the locations of new fires are sent directly to land managers worldwide within hours of the satellite overpass. Together, NASA instruments detect actively burning fires, track the transport of smoke from fires, provide information for fire management, and…

星际空间的地球

星际空间的地球

2019 October 12 Interplanetary Earth Cassini Imaging Team, SSI, JPL, ESA, NASA & NASA/JHU Applied Physics Lab/Carnegie Inst. Washington Explanation: In an interplanetary first, on July 19, 2013 Earth was photographed on the same day from two other worlds of the Solar System, innermost planet Mercury and ringed gas giant Saturn. Pictured on the left, Earth is the pale blue dot just below the rings of Saturn, as captured by the robotic Cassini spacecraft then orbiting the outermost gas giant. On that same day people across planet Earth snapped many of their own of their own pictures of Saturn. On the right, the Earth-Moon system is seen against the dark background of space as captured by the robotic MESSENGER spacecraft, then in Mercury orbit. MESSENGER…

卫星从太空捕捉到四个热带气旋

卫星从太空捕捉到四个热带气旋

On Sept. 4, 2019, a loose chain of tropical cyclones lined up across the Western Hemisphere. At the time of this image (1:10 p.m. EDT) Hurricane Juliette in the East Pacific and Hurricane Dorian in the Atlantic were both category 2 storms. Meanwhile, Tropical Storm Fernand packed sustained winds of 45 mph and had just recently made landfall over northeastern Mexico. Gabrielle strengthened into a tropical storm on September 4 over the eastern Atlantic, and had sustained winds of 50 mph around the time of this image. Data for the simulated natural-color image were acquired with the Advanced Baseline Imager on the Geostationary Operational Environmental Satellite (GOES) 16. GOES-16 is operated by NOAA; NASA helps develop and launch the GOES series of satellites. Image credit:…